Infrastructure Monitoring Platform
Server Fleet Monitor
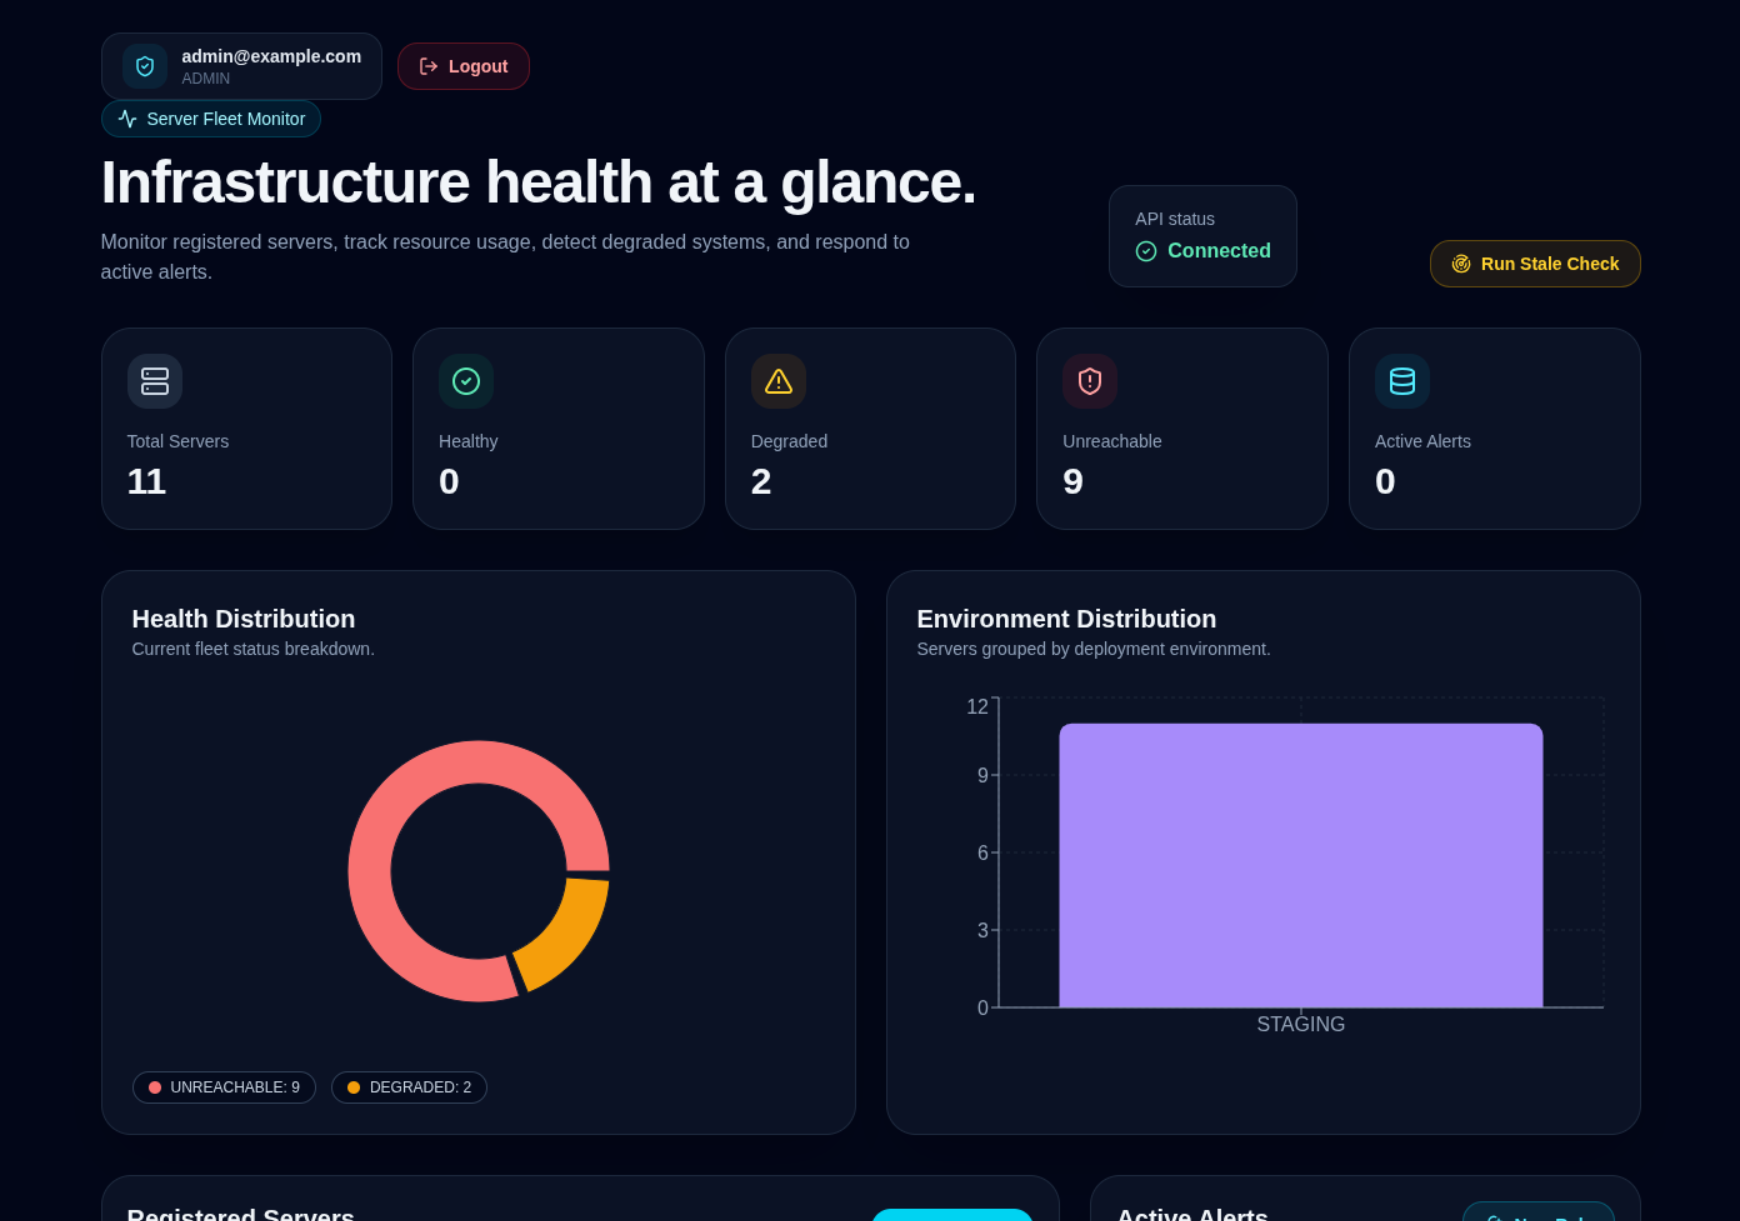
Server Fleet Monitor is an infrastructure observability platform designed to help teams monitor server health, track performance metrics, define alert rules, and maintain operational visibility across distributed environments.
The Problem
As infrastructure grows, teams struggle to maintain visibility into server health, performance degradation, stale metrics, and operational incidents. The challenge was to build a system that centralizes monitoring data and enables proactive issue detection before outages impact users.
The Solution
I designed and implemented a full-stack monitoring platform using NestJS and Next.js. The system provides server inventory management, metrics visualization, configurable alerting rules, activity tracking, and historical analysis through a clean operational dashboard.
Challenges & Decisions
- • Designing extensible alert workflows that support future metric types.
- • Balancing backend efficiency with dashboard responsiveness.
- • Structuring historical metric data for visualization and analysis.
- • Maintaining traceable operational activity across user actions.
- • Implementing realistic monitoring workflows without direct infrastructure integrations.
Outcome
Server Fleet Monitor demonstrates my ability to build operational systems that support observability, incident response, and infrastructure decision-making. It highlights backend architecture skills, data modeling, and the ability to translate technical workflows into usable interfaces.
What I Learned
This project strengthened my ability to think beyond individual features and design complete systems around user flows, data integrity, scalability, maintainability, and real-world product needs.
Key Features
- • Server inventory management
- • Health status monitoring
- • CPU, memory, and disk metric tracking
- • Historical metrics visualization
- • Custom alert rule creation
- • Alert acknowledgment and dismissal
- • Activity and audit logging
- • Filtering and pagination
- • Infrastructure simulation workflows
Tech Stack
Architecture Overview
Next.js Dashboard
Provides operators with visibility into server health, alerts, metrics, and activity history.
NestJS API Layer
Coordinates monitoring workflows, alert management, server operations, and dashboard interactions.
Prisma ORM
Provides strongly typed access to the database and simplifies schema evolution.
PostgreSQL Database
Stores servers, metric snapshots, alert rules, alerts, and activity records.
Monitoring Engine
Evaluates incoming metrics, detects stale conditions, and triggers alert workflows.
Audit & Activity Layer
Captures operational events to improve accountability and troubleshooting.
Project Focus
Product Walkthrough
A glimpse into the key experiences that shape the product journey.
System Flow ⭐⭐⭐⭐
Register Server
Infrastructure assets are added to the monitoring inventory.
Capture Metrics
Metric snapshots are collected and persisted for analysis.
Evaluate Rules
Alert conditions are checked against incoming monitoring data.
Trigger Alerts
Incidents are surfaced when thresholds or stale conditions are detected.
Operator Response
Teams acknowledge, investigate, and dismiss alerts while maintaining operational records.
Audit Activity
All significant actions are logged to support traceability.
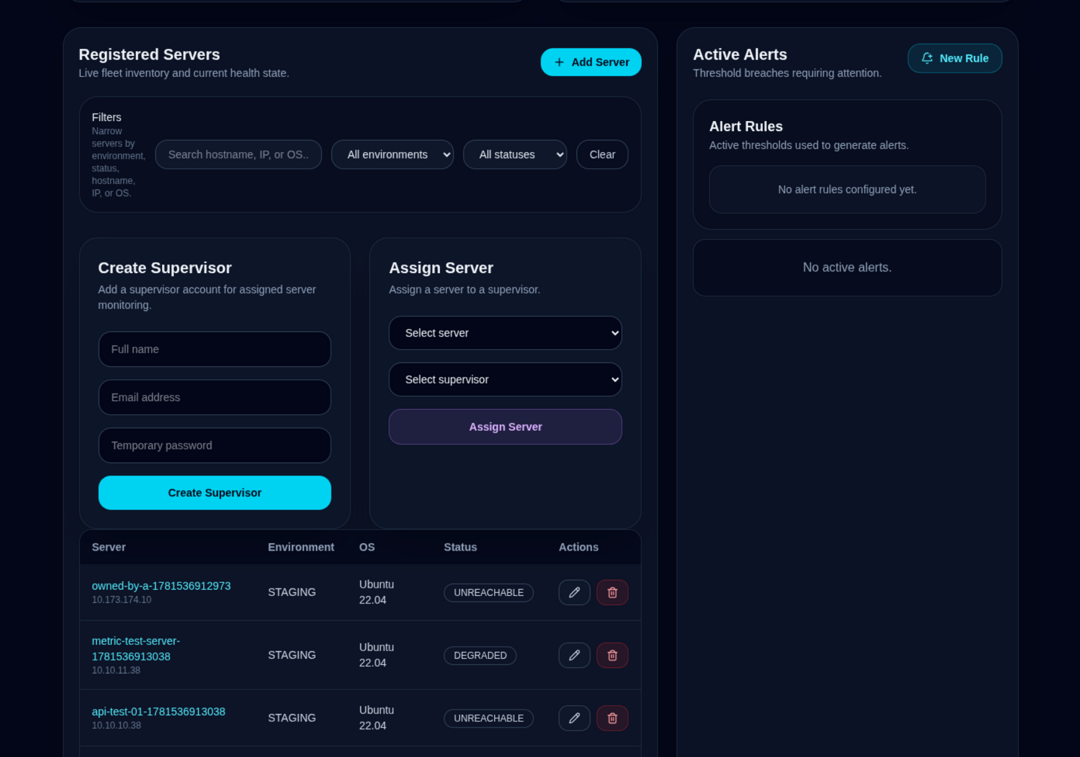
Operations Dashboard
A centralized view of server health, alerts, and infrastructure status.
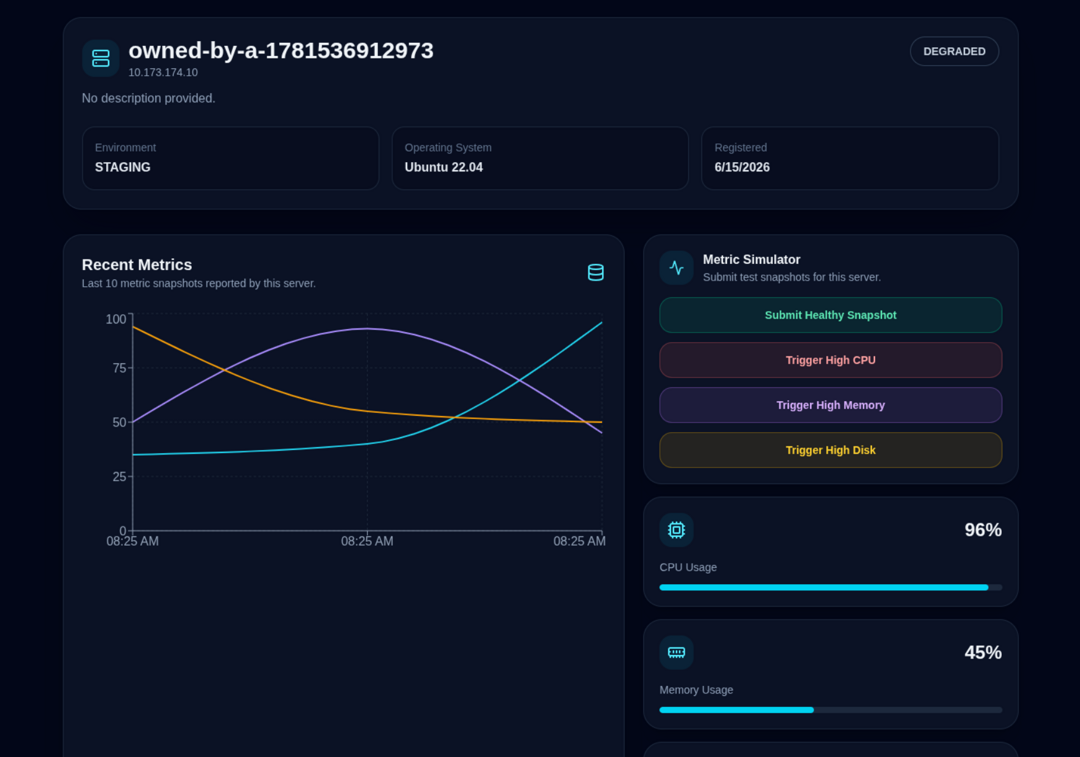
Metrics Visualization
Historical performance charts help identify trends and anomalies.
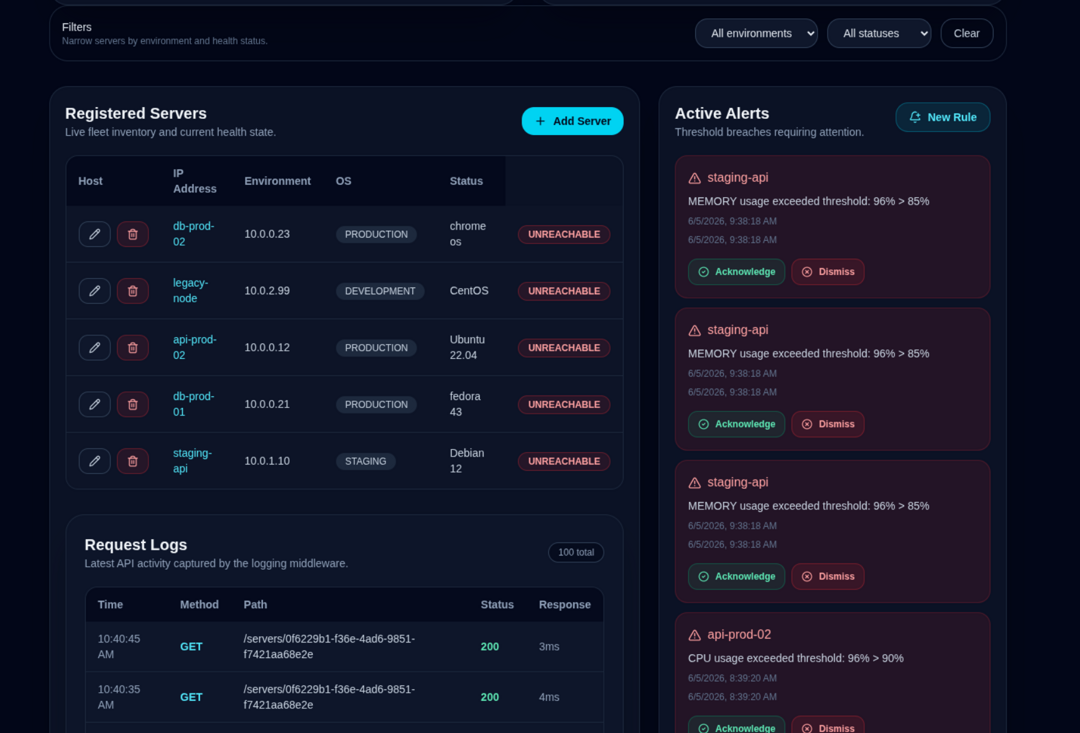
Alert Management
Operators can acknowledge, investigate, and resolve incidents efficiently.
Interested in building something like this?
I design, develop, test, deploy, and automate scalable systems for real-world products and business workflows.
Get In Touch